Introduction
navstats was originally to be called Management statistics and was meant to
cover the need for having relevant statistics regarding your network to show to
your boss or management. However, finding a common ground for what the
management wanted to see turned out to be impossible, and the fleeting and not
very well formulated demands meant that nothing concrete was going to be made
ever.
This lead to a fundamental shift in the proposal. What was implemented was a way
to enable NAV administrators to write SQL-statements that produced the
statistics they wanted and periodically send it to Carbon. Thus the NAV
administrator himself decides what data is important, and the Graphite web-api
enables him to extract data as he wishes - either as a graph directly in NAV or
to other external tools.
The original request and final proposal is available on Launchpad and
GitHub.
Example
We use the example from the config-file that continuously counts the different
types of equipment in the database.
SQL
SELECT vendorid, typename, count(*)
FROM netbox JOIN type USING(typeid)
GROUP BY typename, vendorid;
The query will produce lines like this:
vendorid |        typename         | count
----------+-------------------------+-------
brocade  | 4/24_san_switch         |     1
hp       | hp2610_24               |     2
hp       | hp2610_24_pwr           |     1
Namespace
We choose to put all data in the namespace nav.stats.
Resulting config
[netbox_types]
path=nav.stats.devices.{}.{}
query=select vendorid, typename, count(*)
    from netbox join type using(typeid)
    group by typename, vendorid;
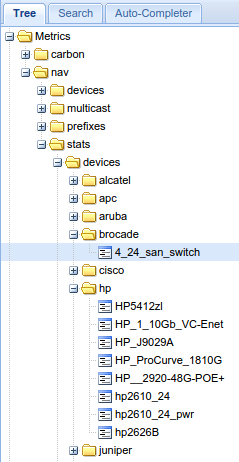
Thus the path for the values above will be:
nav.stats.devices.brocade.4/24_san_switch
nav.stats.devices.hp.hp2610_24
nav.stats.devices.hp.hp2610_24_pwr
(The script will do some modifications to the path to make sure Graphite can
handle them.)
Result
The script (the one that is started as a cron-job when you write nav start
navstats) will make sure to run the SQL and send the output to Graphite.
The result will be browsable in Graphite like shown below. You can use
Graphite’s powerful web-api to access the data in
the format you wish.